
Whole Home Energy Monitoring with Home Assistant
Regular readers and viewers will have seen the screenshots of graphs from Home Assistant’s energy dashboard because I use it all the time. I use it to keep track of how much energy I’m importing and exporting from the grid, how much my batteries are using, and how much my solar panels generate. But I’m going to show you how I’ve taken this energy monitoring to another level, monitoring as many individual devices as I can in my home to get a detailed picture of where we’re using energy.
Shopping List
- Innr SP 242 Smart Plug (UK): https://amzn.to/3EFSuHu
- Shelly Pro 3EM: https://amzn.to/3WTWfPM
- Shelly Pro EM: https://amzn.to/4hMN0ZS
Contents
- Monitoring using Smart Plugs
- Monitoring High Powered Devices and Lighting
- Home Assistant and the Energy Dashboard
- Sankey Charts
Monitoring using Smart Plugs
Whilst I did have some existing energy monitoring devices around the house, for example, a number of z-wave and WiFi smart plugs for things like a heater in my wardrobe and my TV, and my EV charger has built-in energy monitoring, I needed more monitors!
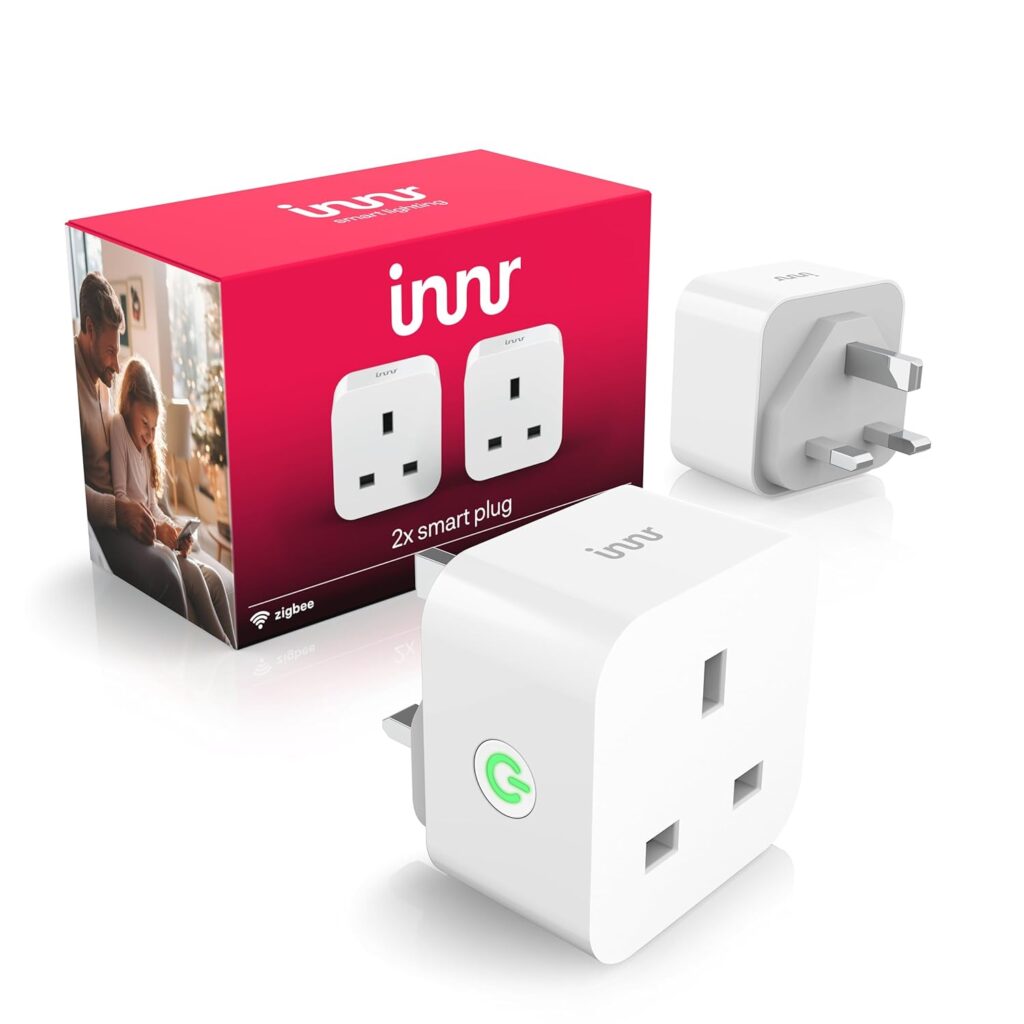
I chose the Innr SP 242 smart plug as my preferred energy monitor for the various plugged-in devices around my home. There were a number of reasons for choosing this specific product:
- It is reasonably priced – you can buy it in multipacks on Amazon: https://amzn.to/3EFSuHu
- It uses the Zigbee protocol, not WiFi, meaning it reduces the congestion on over-burdened WiFi network. I also consider Zigbee more secure due it lacking a direct connection to the network and internet, but you do need a Zigbee co-ordinator as a hub, such as an SMLight one.
- It’s rated for 13A, which is the maximum current that can be drawn from a standard UK plug socket. This is about 3kW, but I wouldn’t recommend you use any smart plug on a 3kW continuous load as this could cause a fire hazard. Be wary of smart plugs claiming to support 16A or 20A, these ratings are above the limit of the socket so may not be accurate specifications for the devices.
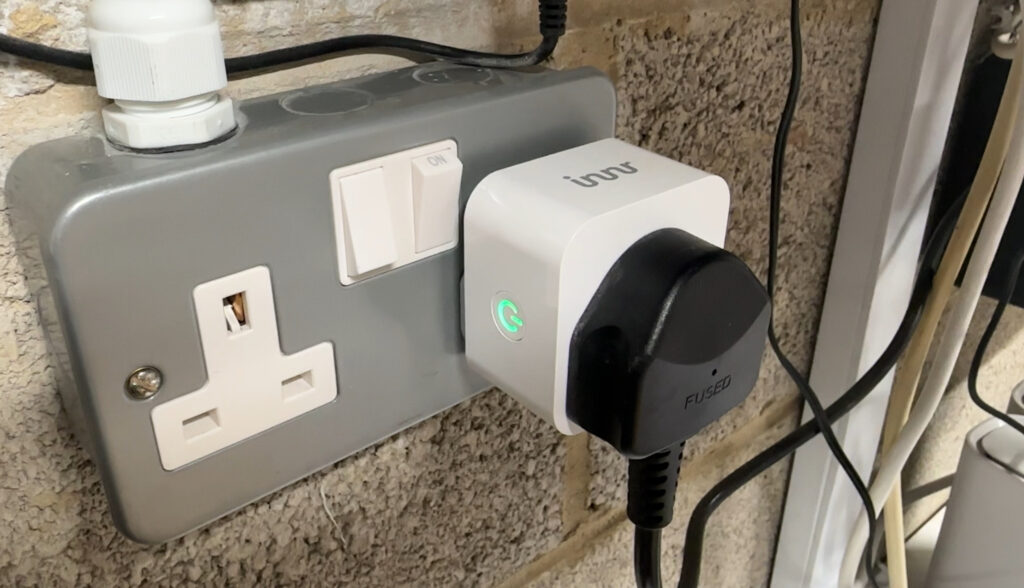
- The physical design of the devices is well thought out. The pins are on a protruding triangular area at the rear of the plug, meaning that you can easily wrap your fingers around the plug in order to pull it out of the socket. Many cheaper smart plugs sit flush with your socket and risk your fingers slipping around the back and touching the pins when pulling out. The Innr design also means that the plug does not cover the power switches on many different socket styles.
I’m using the Innr smart plugs on my server rack, dishwasher, washing machine and (heat pump) tumble dryer. I wouldn’t recommend using a smart plug on a regular tumble dryer due to the constant high power draw, but my heat pump tumble dryer only pulls about 600 watts at peak so is reasonably safe. My dishwasher and washing machine pull about 2kW each at peak but only for short amounts of time. I have tested the plugs on a 2.5kW electric heater and it seemed ok, but I wouldn’t want to leave it unattended personally for safety reasons.
The smart plugs work very well and have been stable for a few months now, but there were a number of quirks whilst getting them up and running. I’m using them with Zigbee2MQTT, if you are using a different Zigbee integration such as ZHA then your mileage may vary. If you are using Zigbee2MQTT then hopefully these tips will save you a bit of stress!
- Make sure you update the firmware on the smart plugs. They support OTA updates in Zigbee2MQTT and without the latest firmware they refuse to automatically update live power and energy values.
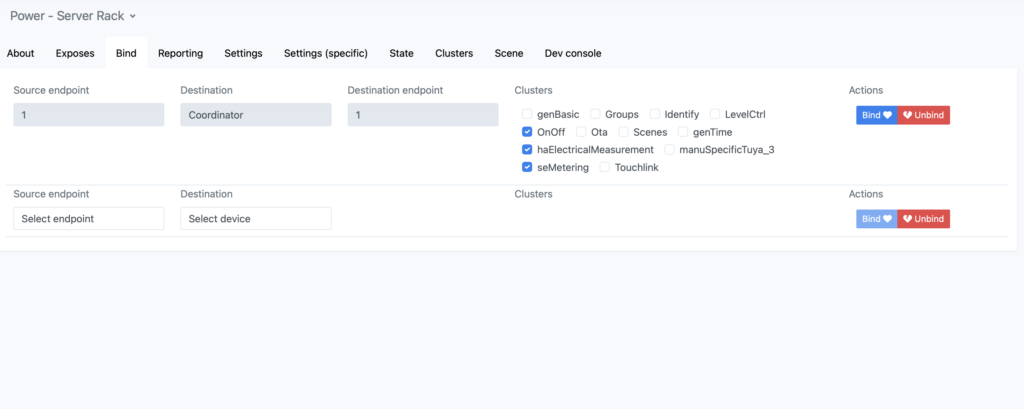
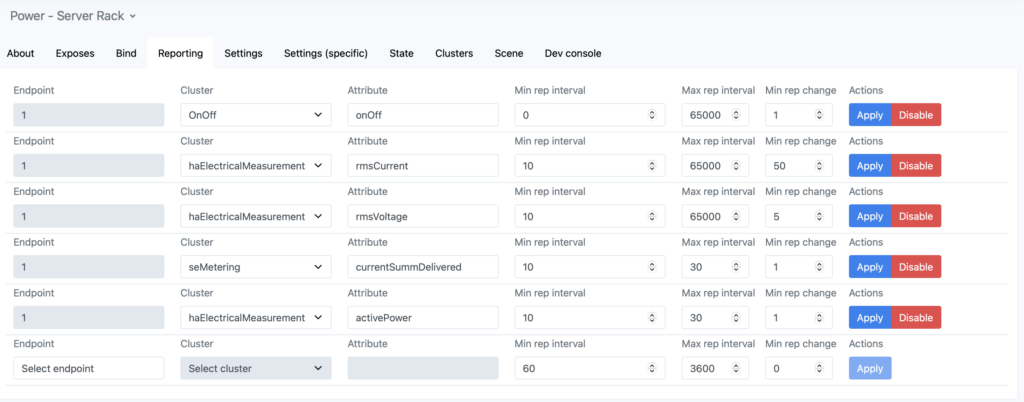
- You’ll probably want to add new reporting clusters/attributes and tweak the existing parameters in Zigbee2MQTT. I’ve included a screenshot in the gallery below showing the reporting attributes and respective parameters that I have set up. I’d recommend you set up the same.
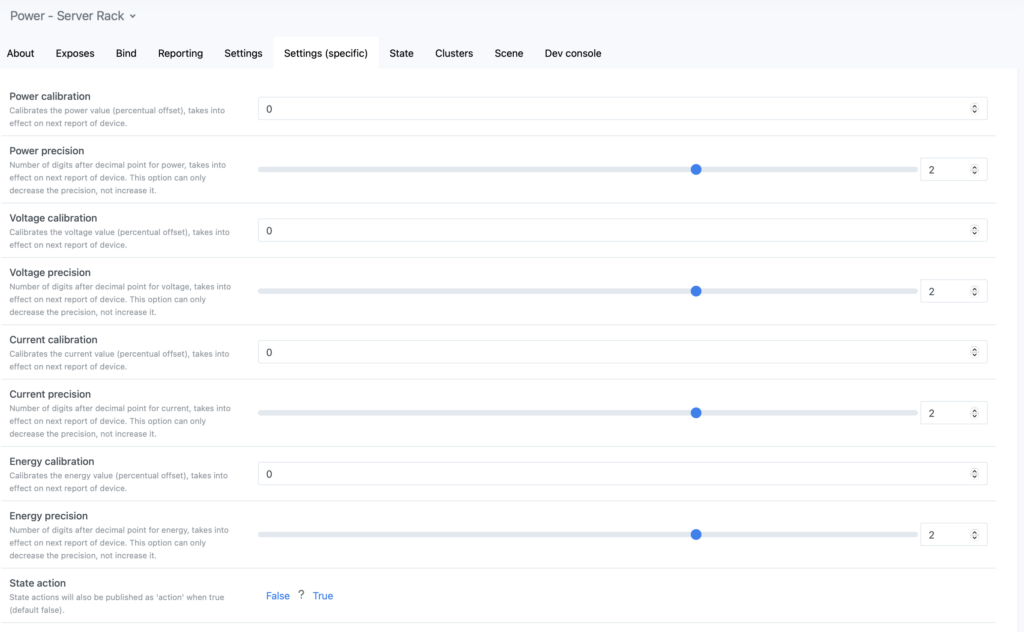
- Under the Zigbee2QTT ‘Settings (specific)’ tab for the device, I found that the various values for calibration and precision had not been set. I manually set the calibrations to 0 and the precisions to 2 for each parameter as appropriate.
Monitoring High Powered Devices and Lighting
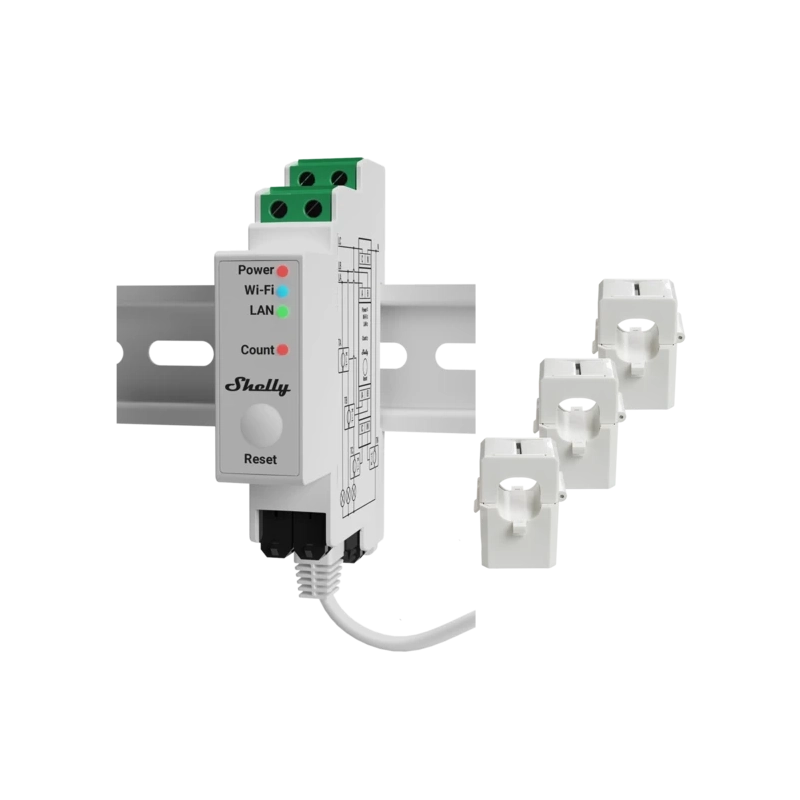
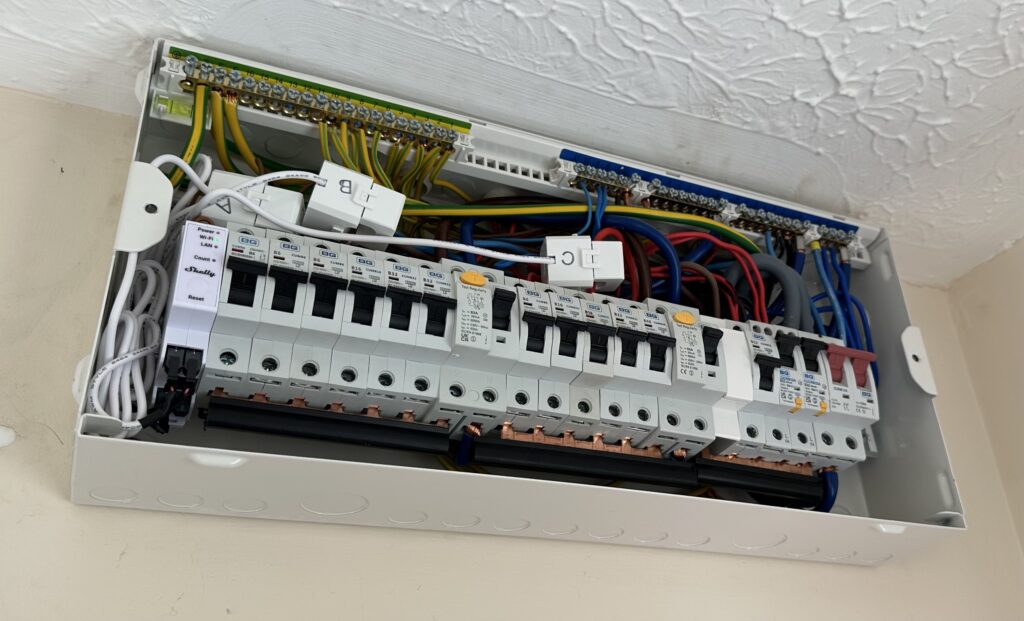
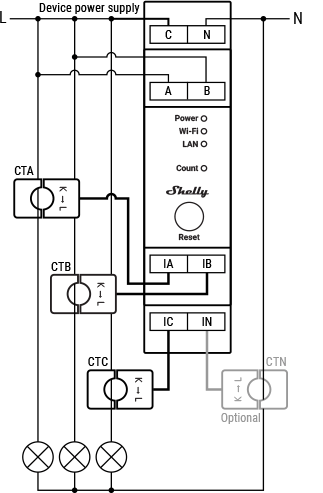
But what about super high powered appliances like my oven? I can’t put that on a smart plug because it draws too much current. It would literally melt a smart plug. And then there’s my lights, there are loads of them and I’d have to find lots of special smart bulbs with power monitoring or something which would be impractical. So instead I decided I needed something to monitor the actual electrical circuits themselves using CT clamps. I already have a Shelly Pro EM for monitoring my heat pump and immersion heater, and Shelly also sell the Shelly Pro 3EM which includes 3 CT clamps. The Pro 3EM is designed to monitor a three-phase supply but can be configured to monitor three uni-phase circuits instead which is perfect for monitoring my oven, upstairs lighting and downstairs lighting circuits. You can buy the Shelly Pro 3EM from Amazon or direct from Shelly’s web site. I had a local electrician install the Pro 3EM in my main consumer unit, ensuring the CT clamps were around the live cables for both lighting circuits and the oven.
Home Assistant and the Energy Dashboard
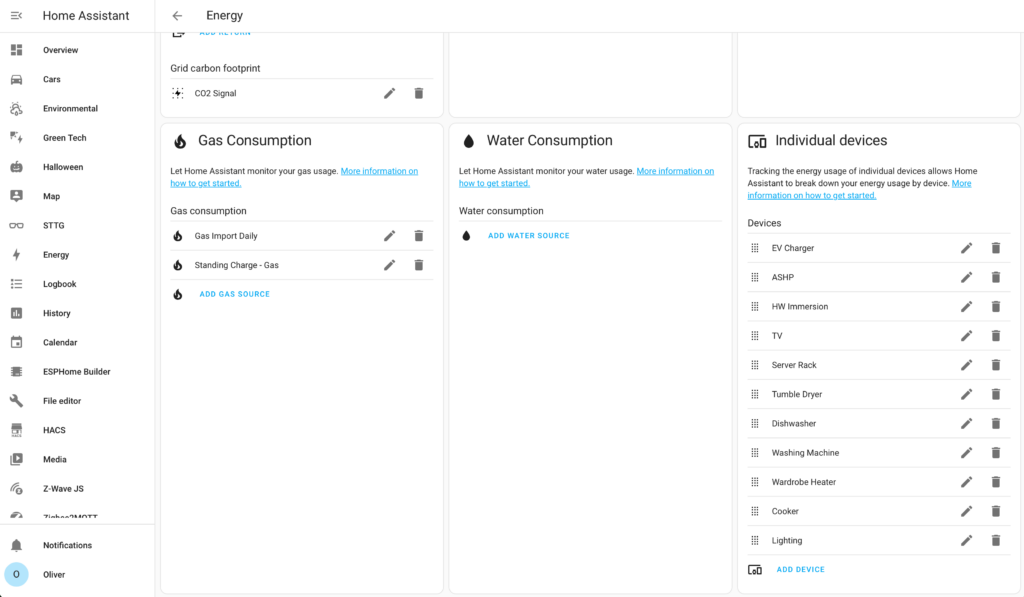
If you check the configuration page for your Energy Dashboard you should notice an ‘Individual Devices’ section. This is where you add all of your various ad-hoc monitored devices around your home. I prefer to wrap each energy sensor in a Utility Meter helper on a daily cycle first because it gives me extra flexibility if I have to change the smart plug in the future. I can just swap the energy sensor over in the helper and I don’t lose any historical data, but you can just add the energy sensors straight into the dashboard if you wish.
Octopus Energy using my referral link:
speaktothegeek.co.uk/energy

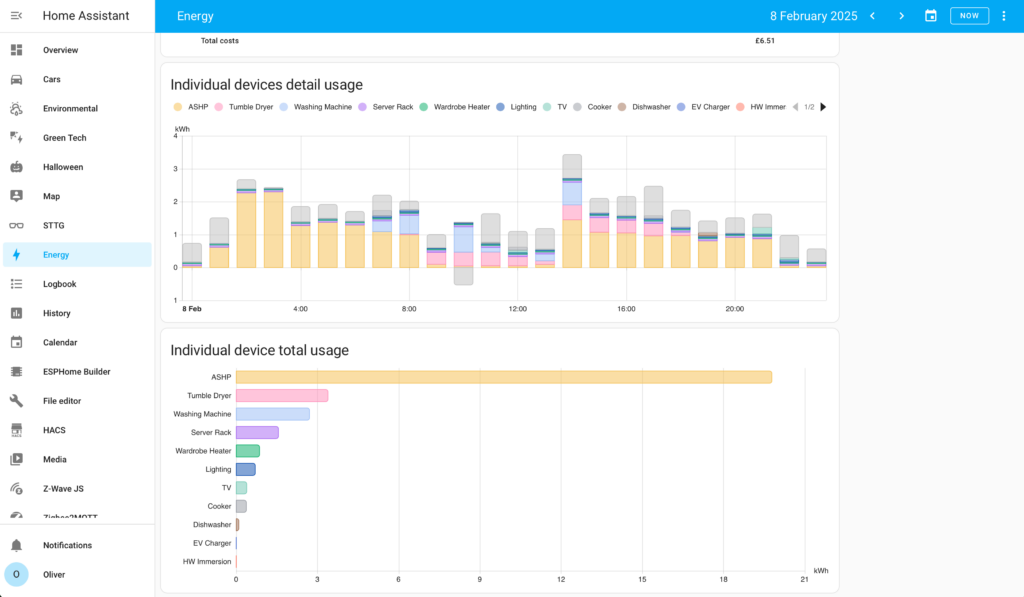
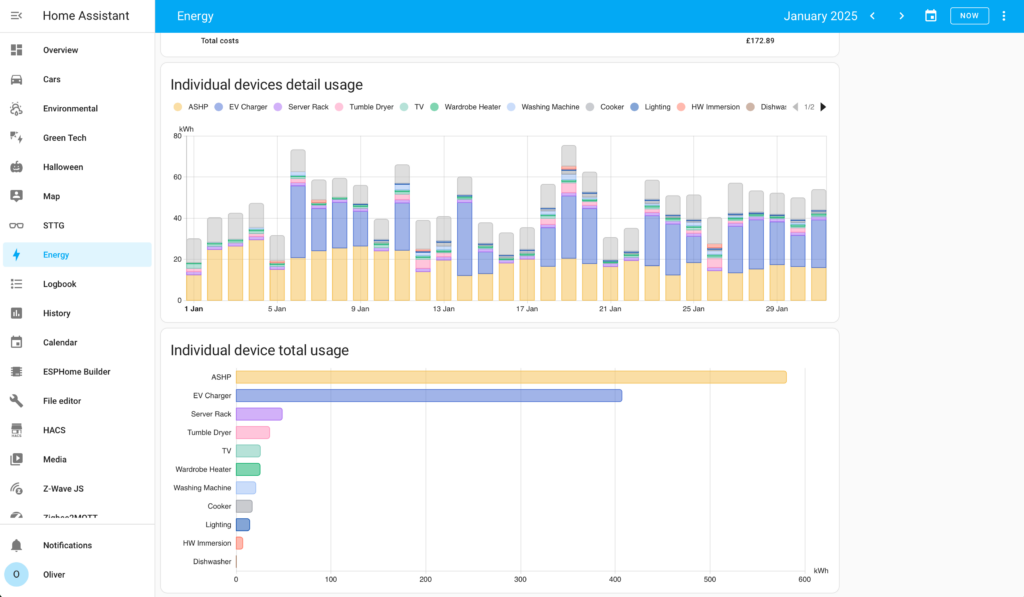
Once added to the dashboard, open it and scroll to the bottom of the page. You should see a couple of fancy graphs. The top graph labelled “Individual devices detail usage” gives you a breakdown of energy use over time. If you have your time period set to a specific day then each bar is equal to an hour, if it’s set to a week or month then each bar is a day. Each device is represented by a different colour in each bar and you can hover your mouse pointer over each segment to view the value.
Below that graph is the “Individual device total usage” graph which displays the total energy consumed by that device over the whole selected time period. Both of these graphs give you a quick at-a-glance idea of which devices are using the most energy in your home and when they are using it.
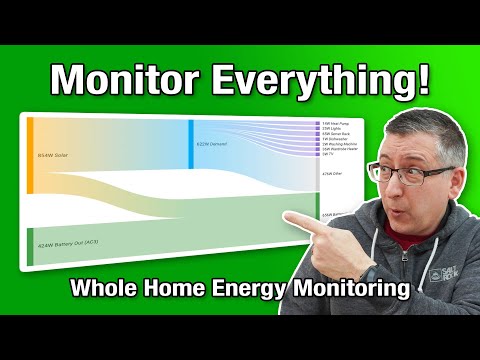
Sankey Charts
My preferred power card in Home Assistant has been the Power Flow Card Plus for quite a while now. It’s easy to configure and looks great on the dashboard. But it does have some limitations when it comes to monitoring your whole home – it is limited to just 4 individual devices due to space restrictions, which is fair enough – you can’t keep adding circles to the diagram because it would descend into madness. So what’s the solution? Well, Sankey Charts are the perfect way to pictorially display flows of data such as power and energy.
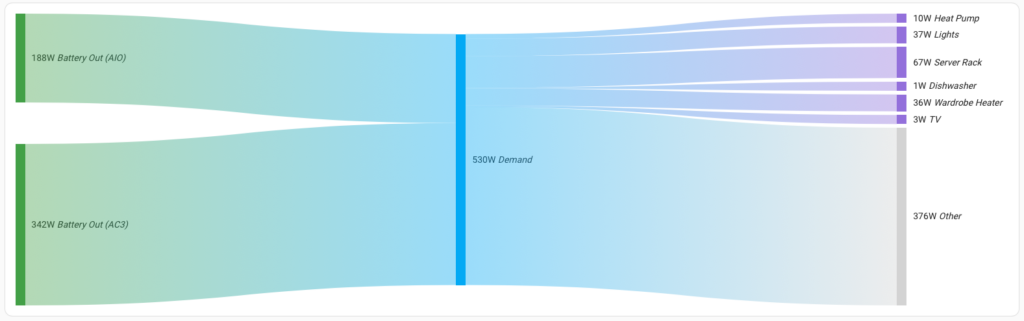
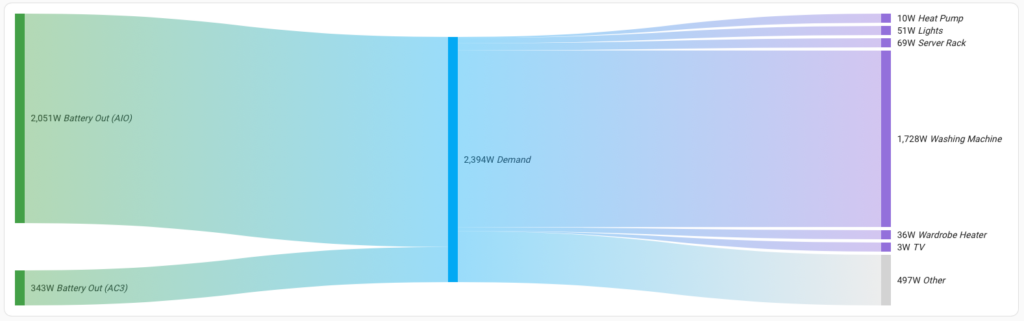
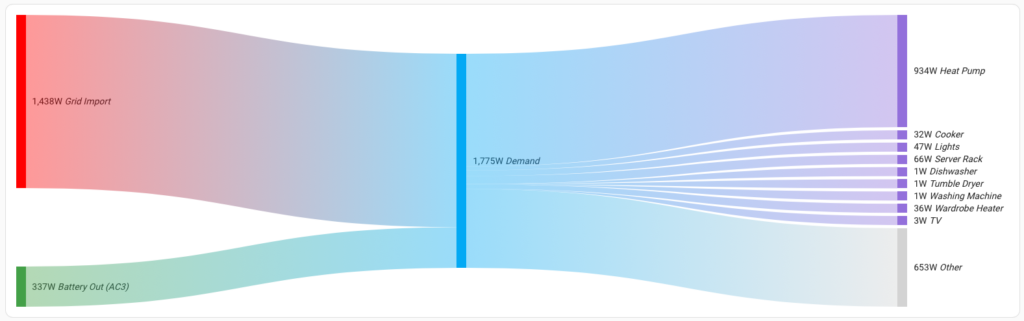
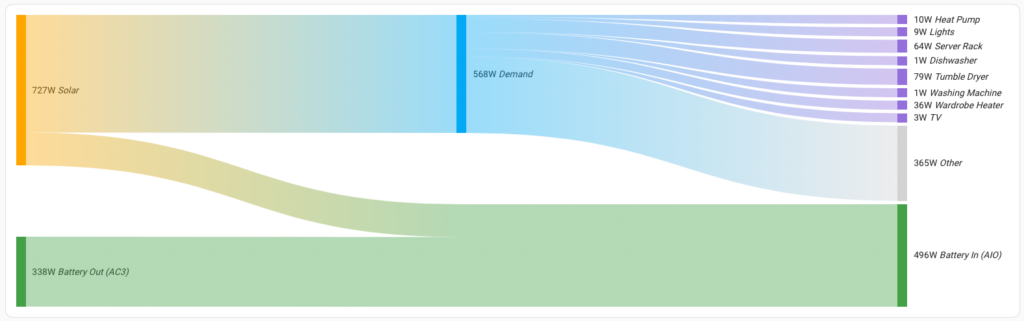
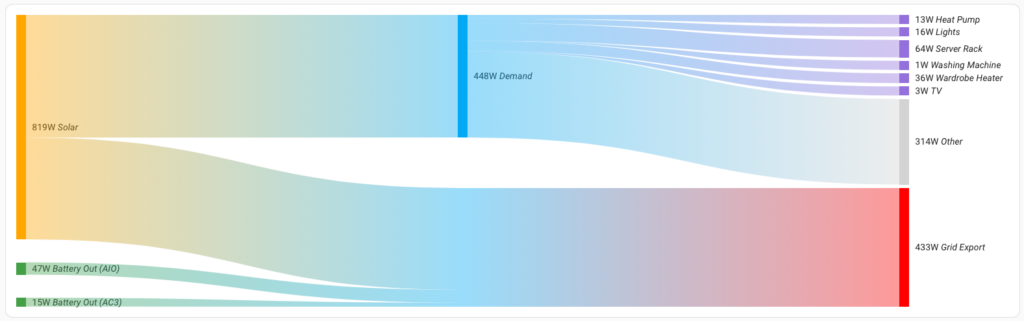
On the face of it a Sankey Chart is an extremely simple concept. Data flows from left to right, optionally passing through various points along the way. For example, in the case of power flow your power can come from solar panels, batteries or the grid and these would be displayed on the left-hand side of the diagram. Over on the right-hand side diagram you have the end destinations for the power which could be your various devices around the home, your batteries if being charged, and even the grid if you are exporting. In between you can define groups as per your own needs. I have chosen to have a single group labelled ‘Home Demand’, but you could easily have ‘Upstairs’, ‘Downstairs’, ‘Garage’, etc, depending on how you are monitoring things.
I used the Sankey Chart Card installed using HACS in Home Assistant. Configuring it can be quite complex – there is a GUI but I found it easier to dive into YAML. You create groups of entities and define their child entities (where the power or energy flows to). You can configure the chart to display power or energy. If configuring for energy it’s possible for it to retrieve its configuration from your existing energy dashboard, however I found that this didn’t display in an ideal format. Remember also that energy flows also require a time period over which the data is shown, whereas power is live data.

To give you a head start, here’s my Sankey Chart Card configuration used to create the card shown in the screenshots above. You can use it as a starting point but remember that all of the various entities are specific to my setup and you will need to change them.
layout: auto
height: 450
unit_prefix: ""
round: 0
convert_units_to: ""
co2_intensity_entity: sensor.co2_signal_co2_intensity
gas_co2_intensity: 2351.6459999999997
min_box_size: 14
min_box_distance: 5
show_states: true
show_units: true
sections:
  - entities:
      - type: entity
        children:
          - sensor.home_power
          - sensor.smart_meter_electricity_power_export
          - sensor.givtcp_ch2315g086_charge_power
          - sensor.givtcp2_ce2122g257_charge_power
        entity_id: sensor.solaredge_ac_power
        color: var(--warning-color)
        name: Solar
      - type: entity
        children:
          - sensor.home_power
          - sensor.givtcp_ch2315g086_charge_power
          - sensor.givtcp2_ce2122g257_charge_power
        entity_id: sensor.smart_meter_electricity_power_import
        name: Grid Import
        color: red
      - type: entity
        children:
          - sensor.home_power
          - sensor.smart_meter_electricity_power_export
          - sensor.givtcp2_ce2122g257_charge_power
        entity_id: sensor.givtcp_ch2315g086_discharge_power
        color: var(--success-color)
        name: Battery Out (AIO)
      - type: entity
        children:
          - sensor.home_power
          - sensor.smart_meter_electricity_power_export
          - sensor.givtcp_ch2315g086_charge_power
        entity_id: sensor.givtcp2_ce2122g257_discharge_power
        color: var(--success-color)
        name: Battery Out (AC3)
  - entities:
      - type: entity
        children:
          - sensor.ashp_power
          - sensor.shellypro3em_fce8c0d83374_em2_power
          - sensor.givenergy_ev_power
          - sensor.immersion_power
          - sensor.lighting_power
          - sensor.power_server_rack_power
          - sensor.power_dishwasher_power
          - sensor.power_tumble_dryer_power
          - sensor.power_washing_machine_power
          - sensor.wardrobe_heater_electric_w
          - sensor.tv_power_power
          - other_stuff
        entity_id: sensor.home_power
        name: Demand
      - type: passthrough
        children: []
        entity_id: sensor.smart_meter_electricity_power_export
        name: Grid Export
      - type: passthrough
        children: []
        entity_id: sensor.givtcp_ch2315g086_charge_power
        color: var(--success-color)
        name: Battery In (AIO)
      - type: passthrough
        children: []
        entity_id: sensor.givtcp2_ce2122g257_charge_power
        color: var(--success-color)
        name: Battery Out (AC3)
  - entities:
      - type: entity
        children: []
        entity_id: sensor.ashp_power
        name: Heat Pump
        color: MediumPurple
      - type: entity
        children: []
        entity_id: sensor.shellypro3em_fce8c0d83374_em2_power
        name: Cooker
        color: MediumPurple
      - type: entity
        children: []
        entity_id: sensor.givenergy_ev_power
        name: EV Charger
        color: MediumPurple
      - type: entity
        children: []
        entity_id: sensor.immersion_power
        name: HW Immersion
        color: MediumPurple
      - type: entity
        children: []
        entity_id: sensor.lighting_power
        name: Lights
        color: MediumPurple
      - type: entity
        children: []
        entity_id: sensor.power_server_rack_power
        name: Server Rack
        color: MediumPurple
      - type: entity
        children: []
        entity_id: sensor.power_dishwasher_power
        name: Dishwasher
        color: MediumPurple
      - type: entity
        children: []
        entity_id: sensor.power_tumble_dryer_power
        name: Tumble Dryer
        color: MediumPurple
      - type: entity
        children: []
        entity_id: sensor.power_washing_machine_power
        name: Washing Machine
        color: MediumPurple
      - type: entity
        children: []
        entity_id: sensor.wardrobe_heater_electric_w
        name: Wardrobe Heater
        color: MediumPurple
      - type: entity
        children: []
        entity_id: sensor.tv_power_power
        name: TV
        color: MediumPurple
      - type: remaining_parent_state
        children: []
        entity_id: other_stuff
        name: Other
        color: lightgrey
      - type: entity
        children: []
        entity_id: sensor.smart_meter_electricity_power_export
        name: Grid Export
        color: red
      - type: entity
        children: []
        entity_id: sensor.givtcp_ch2315g086_charge_power
        color: var(--success-color)
        name: Battery In (AIO)
      - type: entity
        children: []
        entity_id: sensor.givtcp2_ce2122g257_charge_power
        color: var(--success-color)
        name: Battery Out (AC3)
show_names: true
type: custom:sankey-chart
min_state: 0
wide: true
grid_options:
  columns: full
  rows: auto